

Online Risk Based Systems
ORBS™ (Online Risk Based Systems™) is an ingenious new risk framework solution for intelligent reporting and supervision. It has been created to help governments, regulatory authorities and supervisors understand and assess the levels of AML/CFT risk within their jurisdiction.

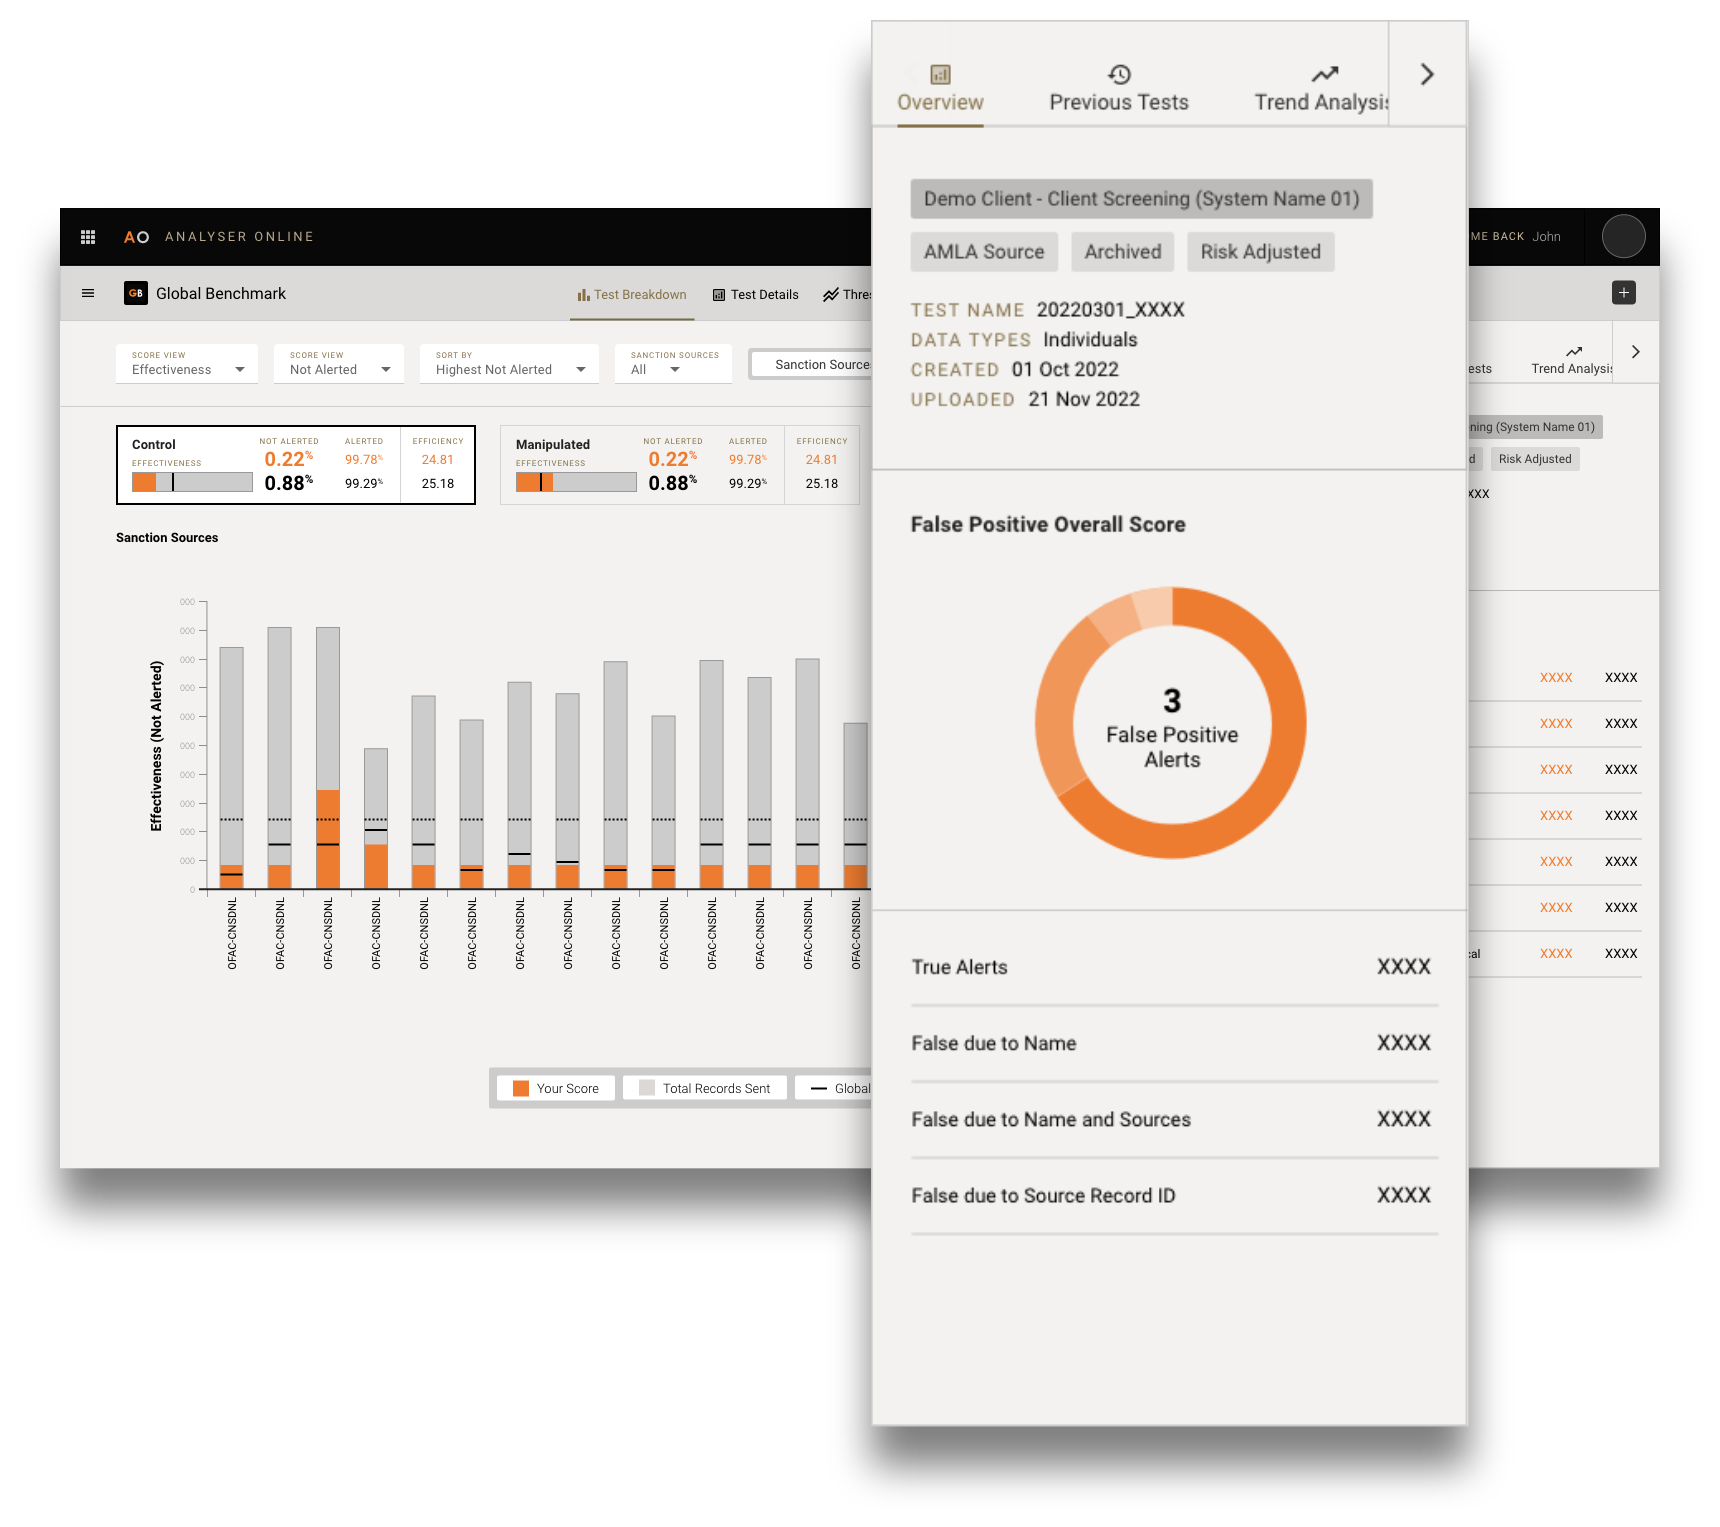
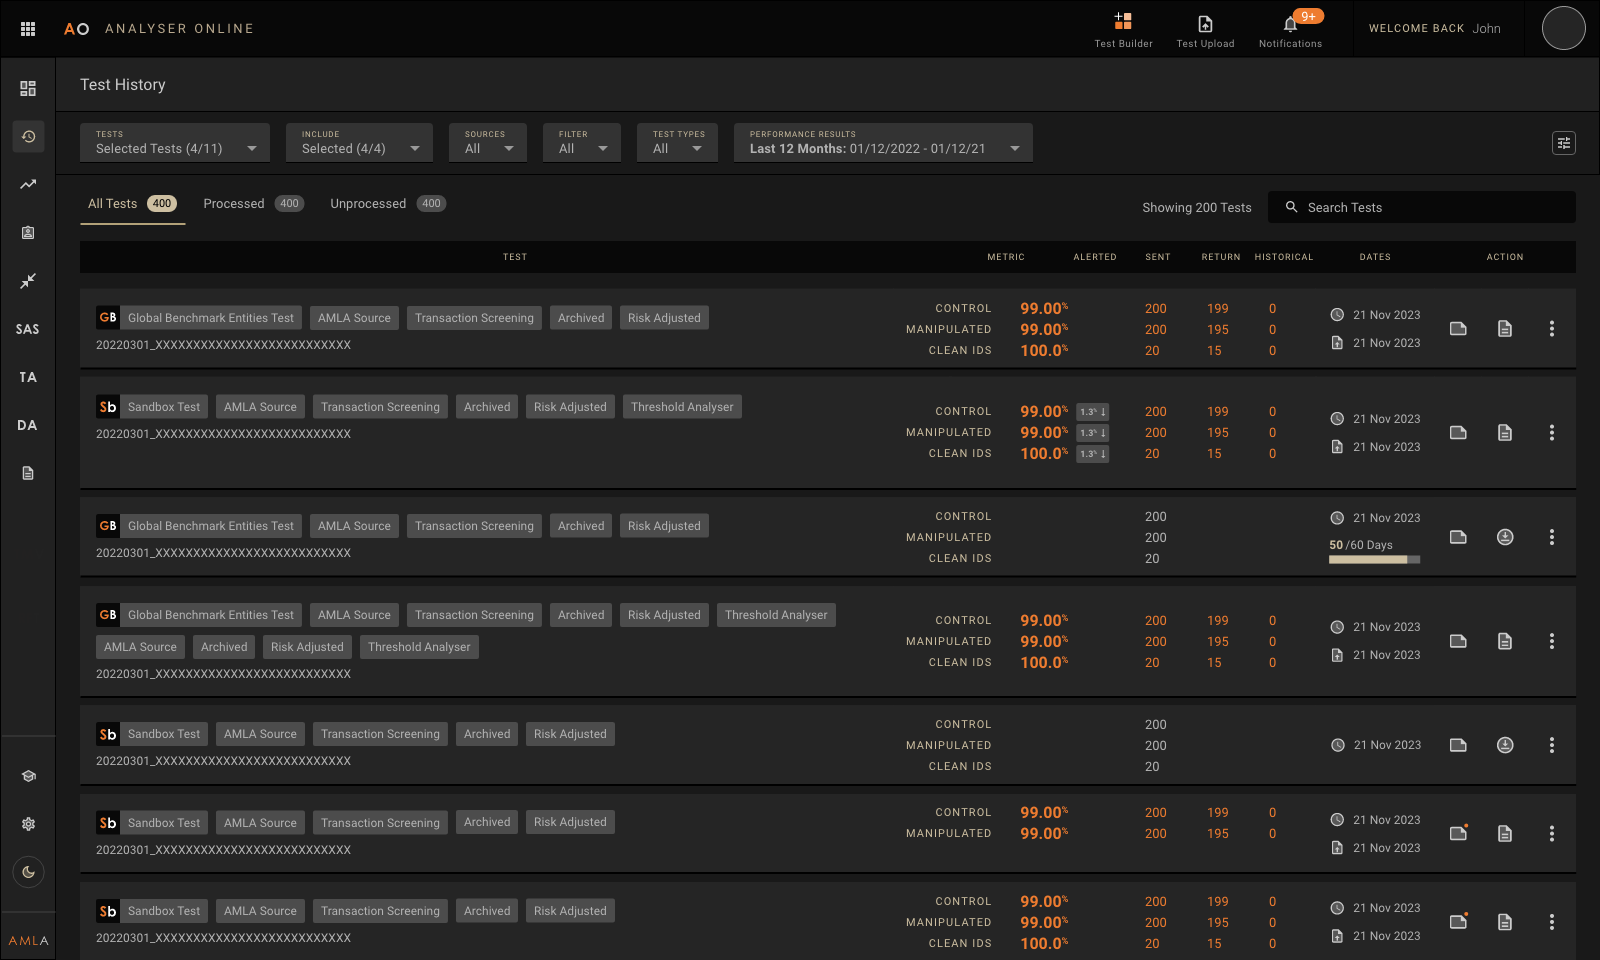
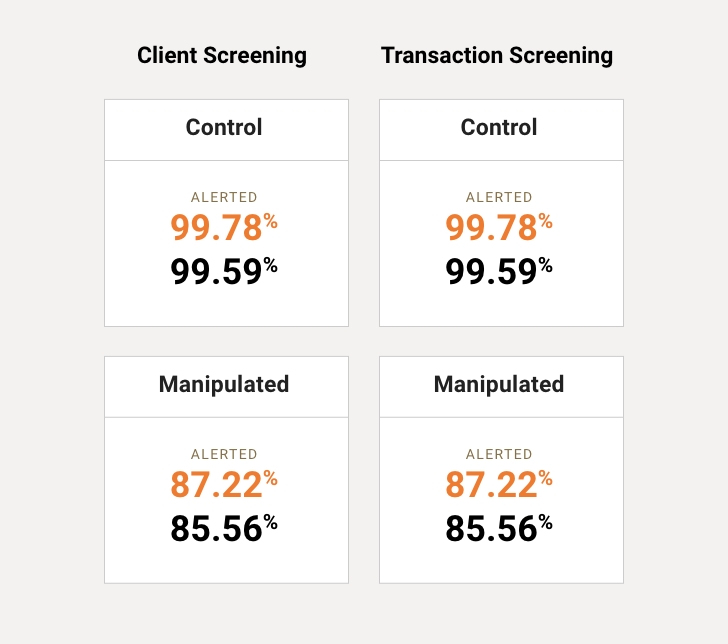
Analyser Online
Analyser Online is our customer communication hub. It provides access to the most advanced hosted testing facility for sanction screening and transaction monitoring system technologies, offering powerful analytics to help our customers understand test results quickly and easily and take remedial action to mitigate financial crime risk.
Learn More
Global Benchmark
Subscribe to Global Benchmark to measure your sanction screening system performance in terms of efficiency and effectiveness and then regularly benchmark your scores to the industry-standard aggregated scores of your peers around the world.
Learn More

Sandbox
Learn More

Annual Assurance Testing
AAT is a new, versatile solution that provides a flexible approach to testing a sanction screening system, facilitating the creation of a bespoke test on a recurring annual basis.

Red Flag Tests
Red Flag Tests is designed to carry out an on-the-spot transaction monitoring system health check by exercising red flag rules using Smart Scenarios consisting of millions of rows of synthetic transaction data to mimic the exact transactional patterns of defined money laundering typologies.

Transaction Monitoring Validator
TMV (Transaction Monitoring Validator) is an innovative RegTech solution to enable ongoing, frequent validation and testing of a transaction monitoring system in line with current regulatory requirements.
Learn More

Sanctions Alert Service
The free Sanctions Alert Service (SAS) from AML Analytics provides details of real-time updates to important sanction lists worldwide, allowing financial institutions to monitor sanction list changes as they happen.